Get Indexology® Blog updates via email.

In This List

GICS' Silver Jubilee

Back to Basics: Remembering the "Income" in Fixed Income

Beyond Diversification: U.S. Equity and Sector Relevance in Mexico

Indexing Covered Calls for Insurance

Equal Weight Indexing in Canadian Equities

GICS' Silver Jubilee

Contributor Image
Sherifa Issifu

Associate Director, Global Exchanges

S&P Dow Jones Indices

The Global Industry Classification System (GICS®) celebrated its 25th birthday in August 2024. Jointly maintained by S&P Dow Jones Indices (S&P DJI) and MSCI, GICS offers a common way to talk about market segments and their respective performances.

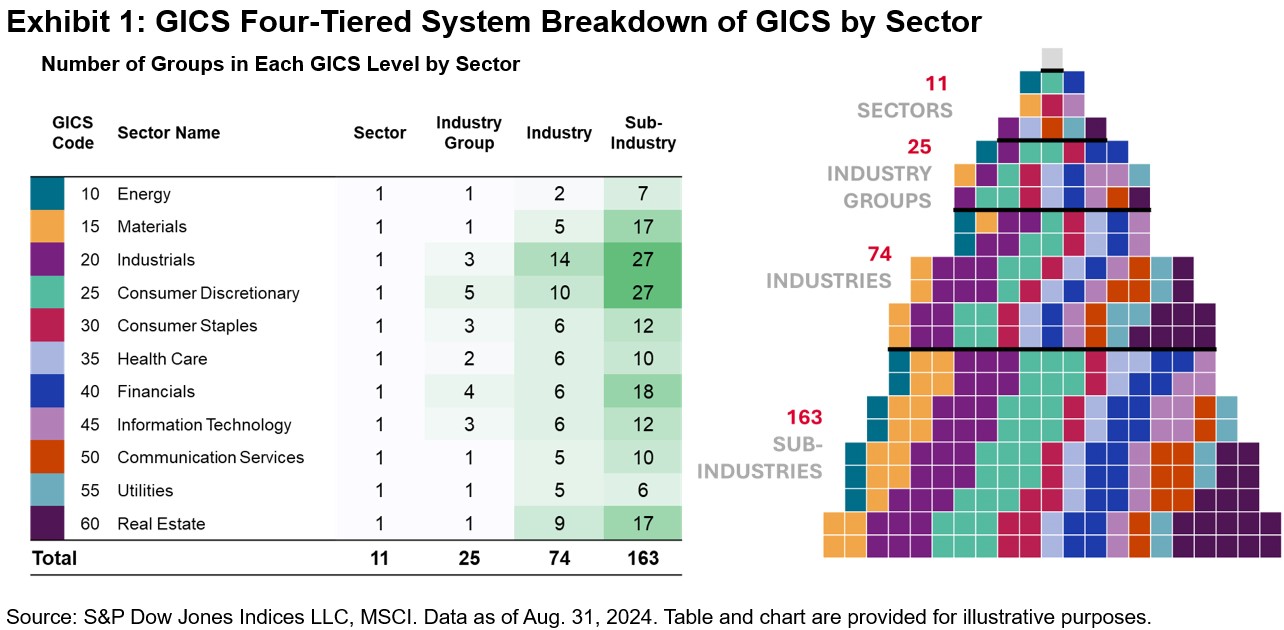
GICS primarily uses revenues to group companies according to their principal business activities, with earnings and market perception among other factors that are also considered. Each company is assigned to one of the more than 160 sub-industries, which then determines—in decreasing granularity—its industry, industry group and sector classifications. Exhibit 1 provides an overview of the latest GICS structure.

Grouping companies by their principal business activities means that companies in the same sector typically have shared sensitivities to common drivers of returns and macroeconomic variables. Crucially, though, these sensitivities may differ across sectors. Hence, sector-based perspectives may be relevant for market participants looking to implement sectors in either active or passive portfolio construction, or both.

Sectors and the detailed GICS framework allow for attribution analysis for broad-based benchmarks like the S&P 500® to determine which segments are leading or lagging and how they impact returns.

Exhibit 2 provides a full breakdown of the contribution of the IT sector to the S&P 500’s calendar year performance since the 1990s. Amid investors’ recent focus on the anticipated impact of artificial intelligence on IT companies’ growth prospects, IT has accounted for 40% of the S&P 500’s performance so far in 2024. In contrast, IT was a relatively nascent sector in the early 1990s, explaining why Technology had little to no impact on the S&P 500’s annual returns.

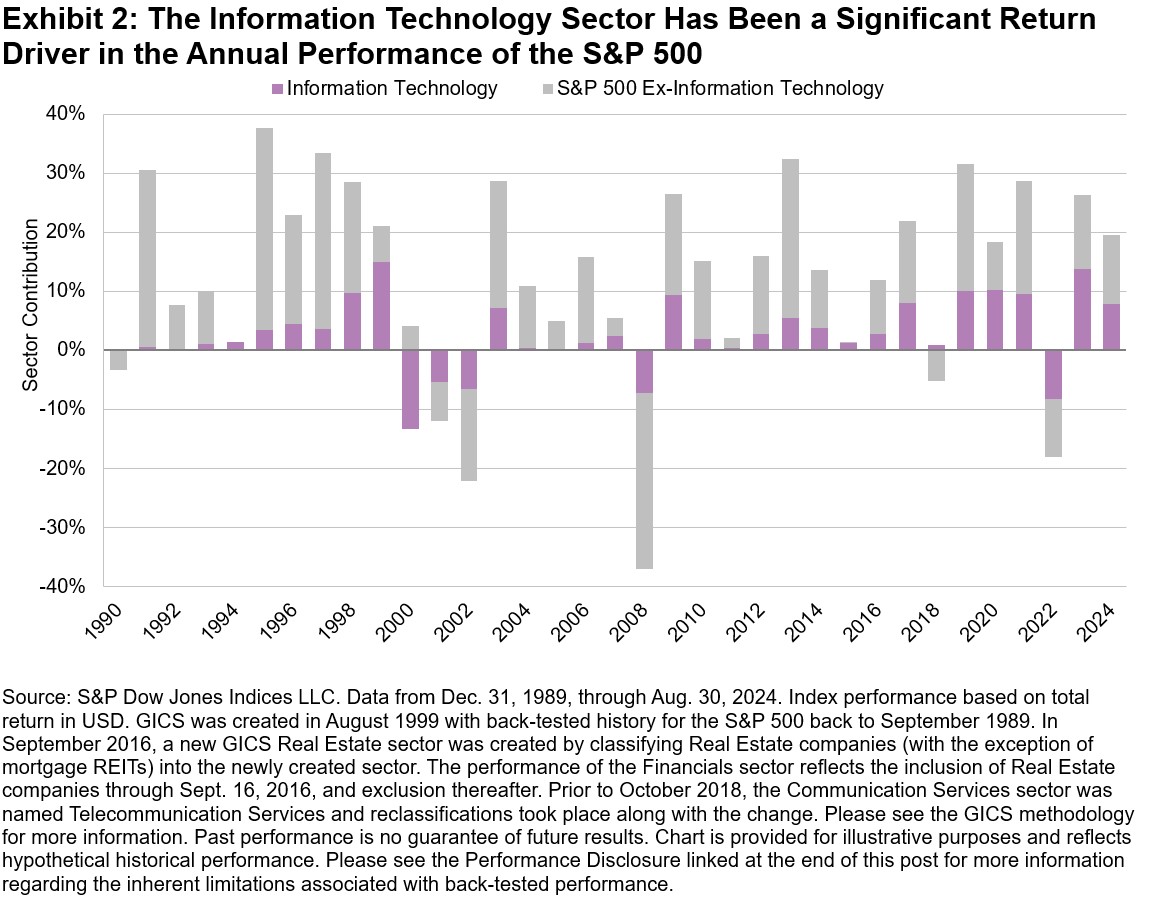
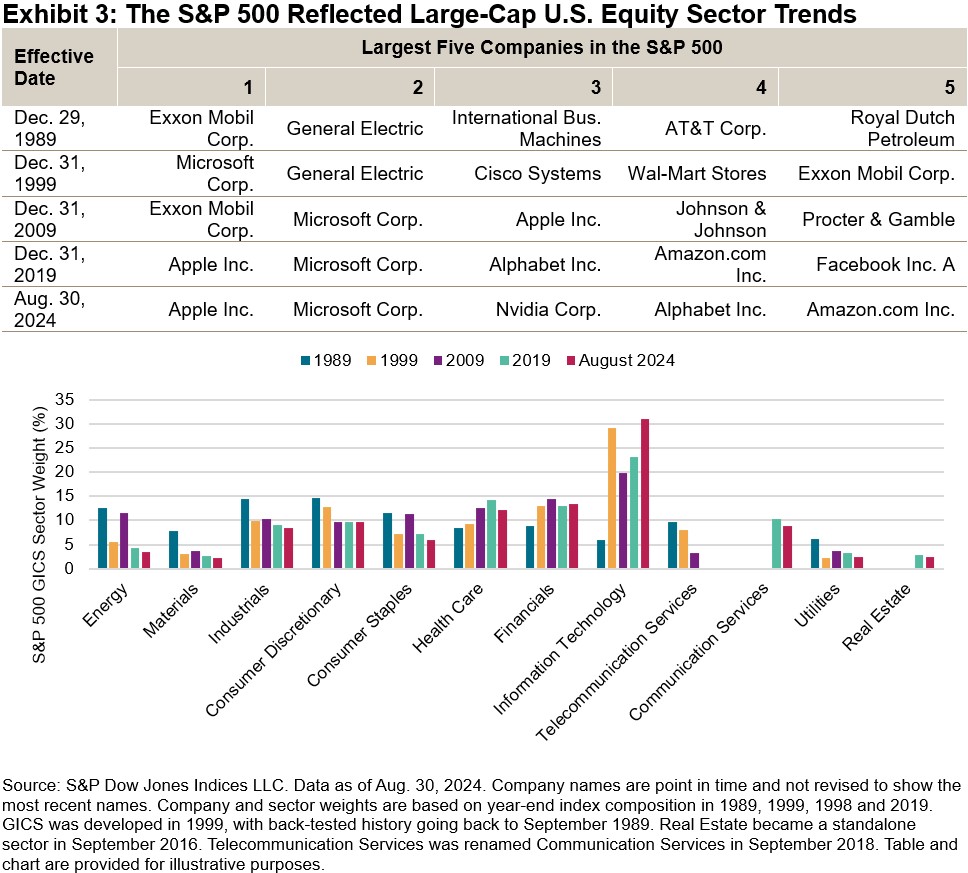
Exhibit 3 shows the evolution of the largest companies in the S&P 500, as well as the index’s GICS sector weights, which reflect the increased importance of Information Technology companies and the decline of traditional/old economy sectors such as Energy, Industrials and Telecommunication Services.

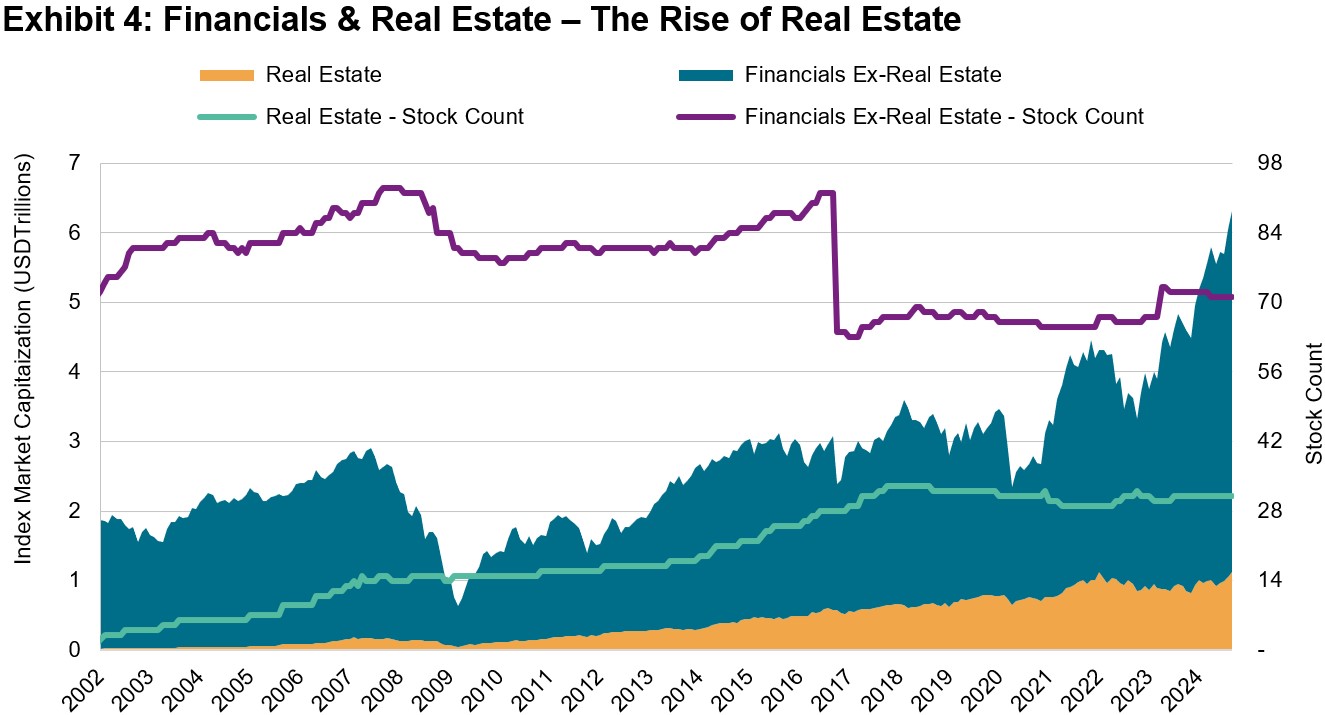
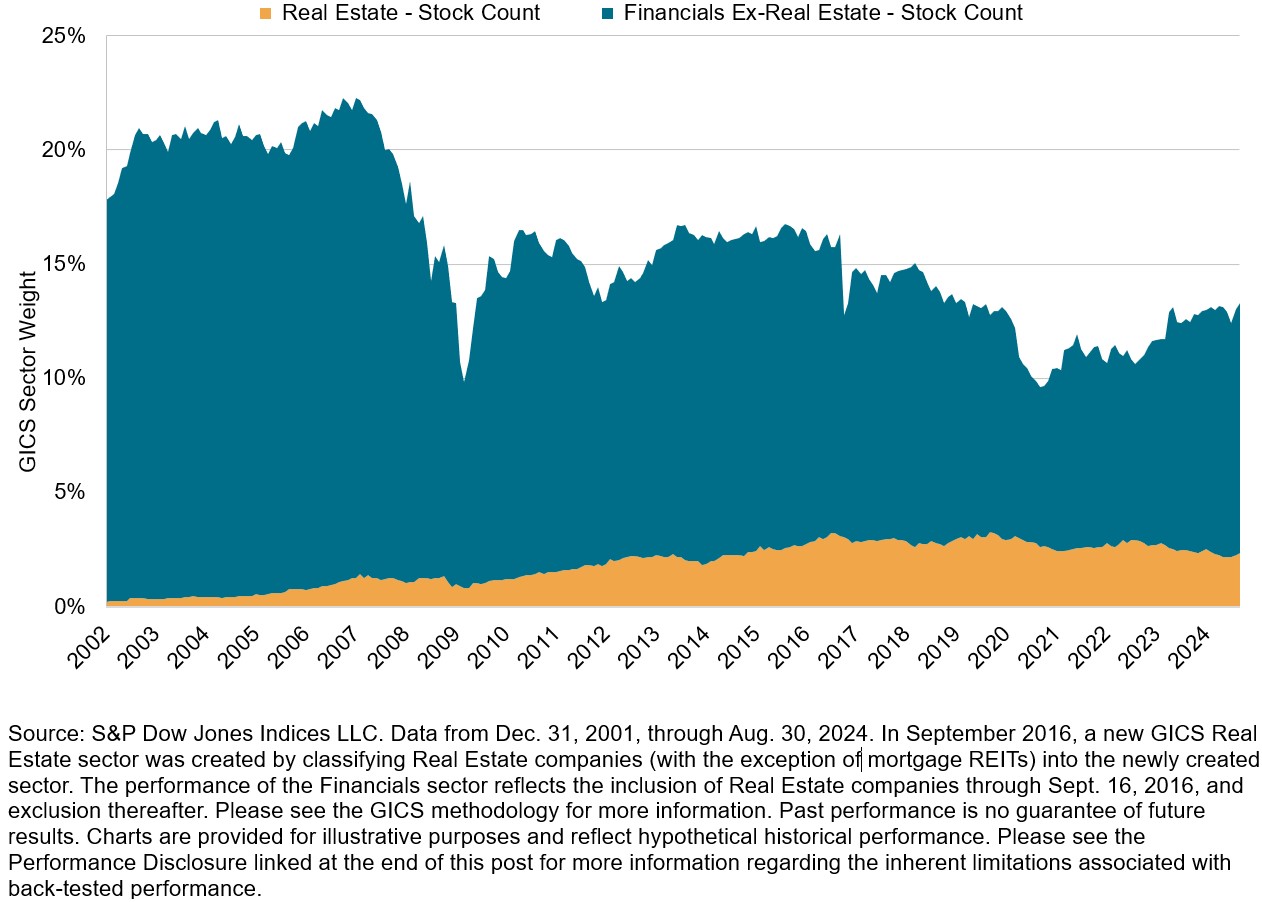
GICS is not a static structure: There have been several changes over time to reflect the market evolutions. One of the largest changes came in 2016 when Real Estate became a standalone sector; previously it was part of Financials. This change reflected growing representation of real estate investment trusts (REITs) and the distinct characteristics of Real Estate companies compared to the rest of the Financials sector.

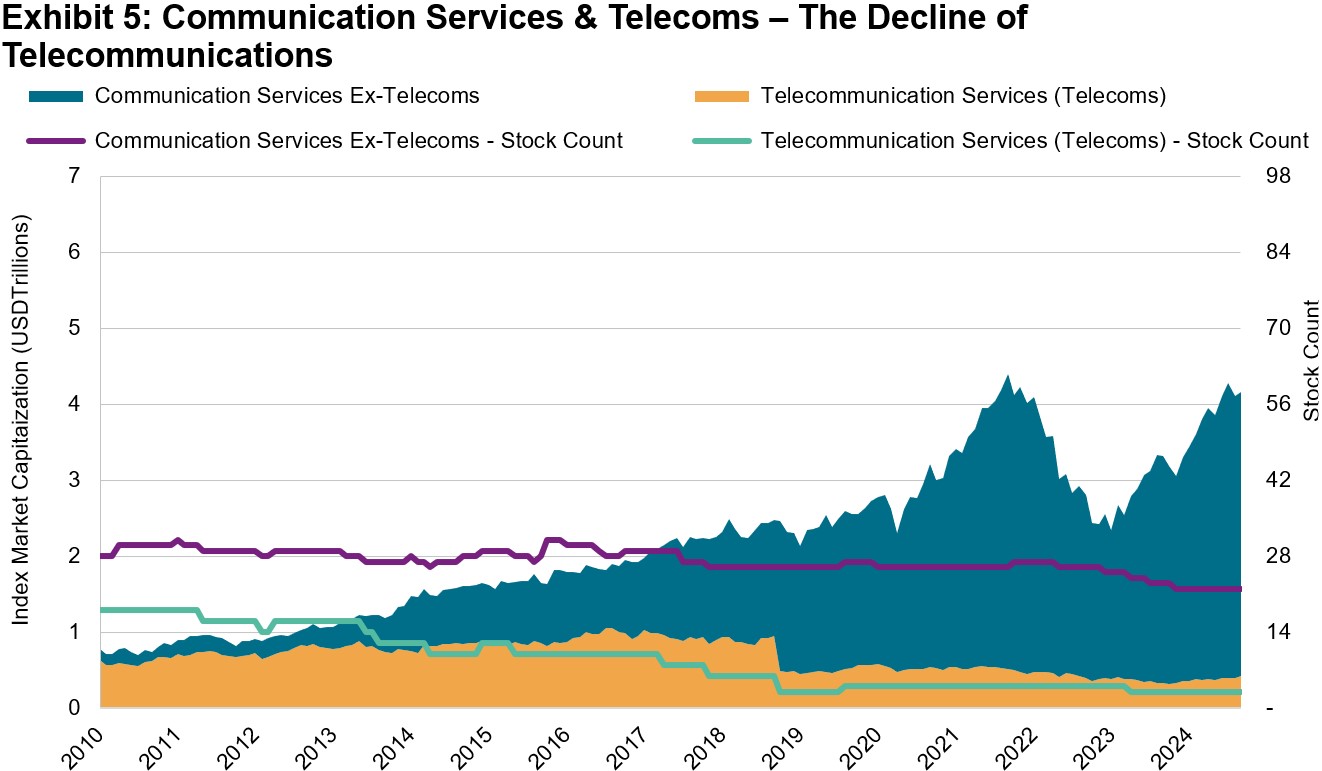
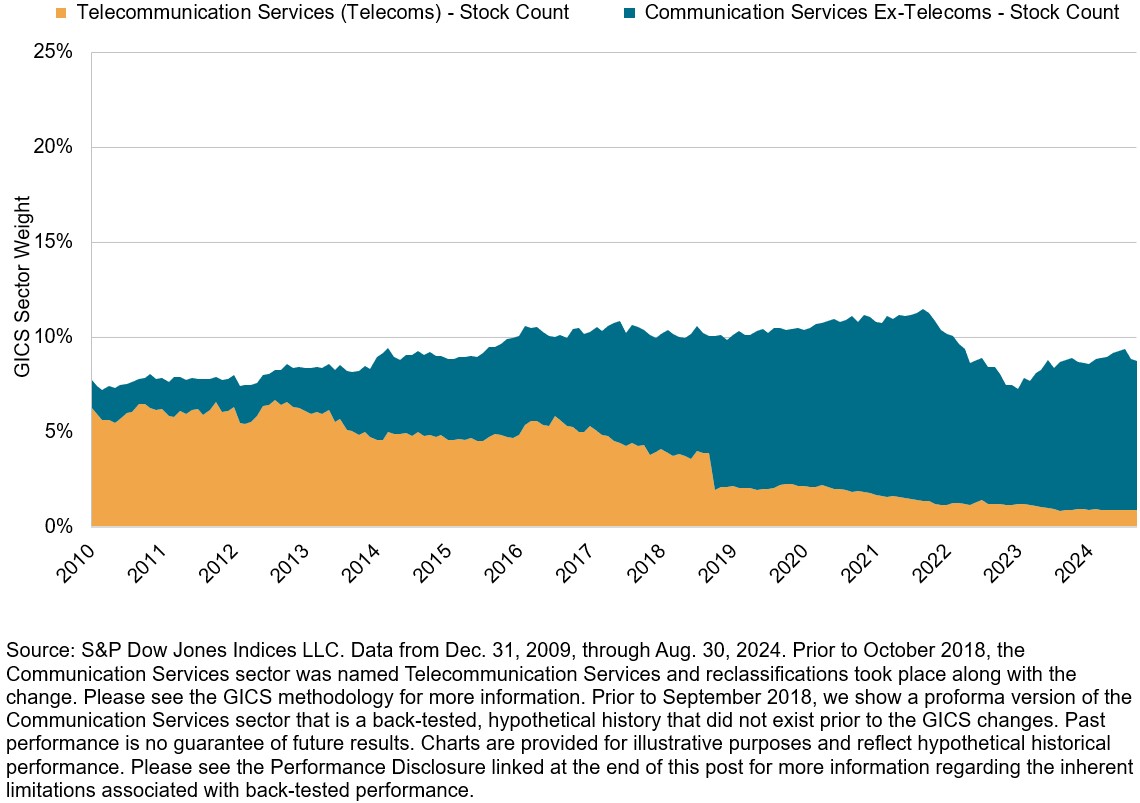
Another key change came in 2018, when the Telecommunication Services sector was renamed Communication Services and various companies were moved across the GICS structure. This was in response to changes in the ways people communicate: from telephone to email, text and social media.

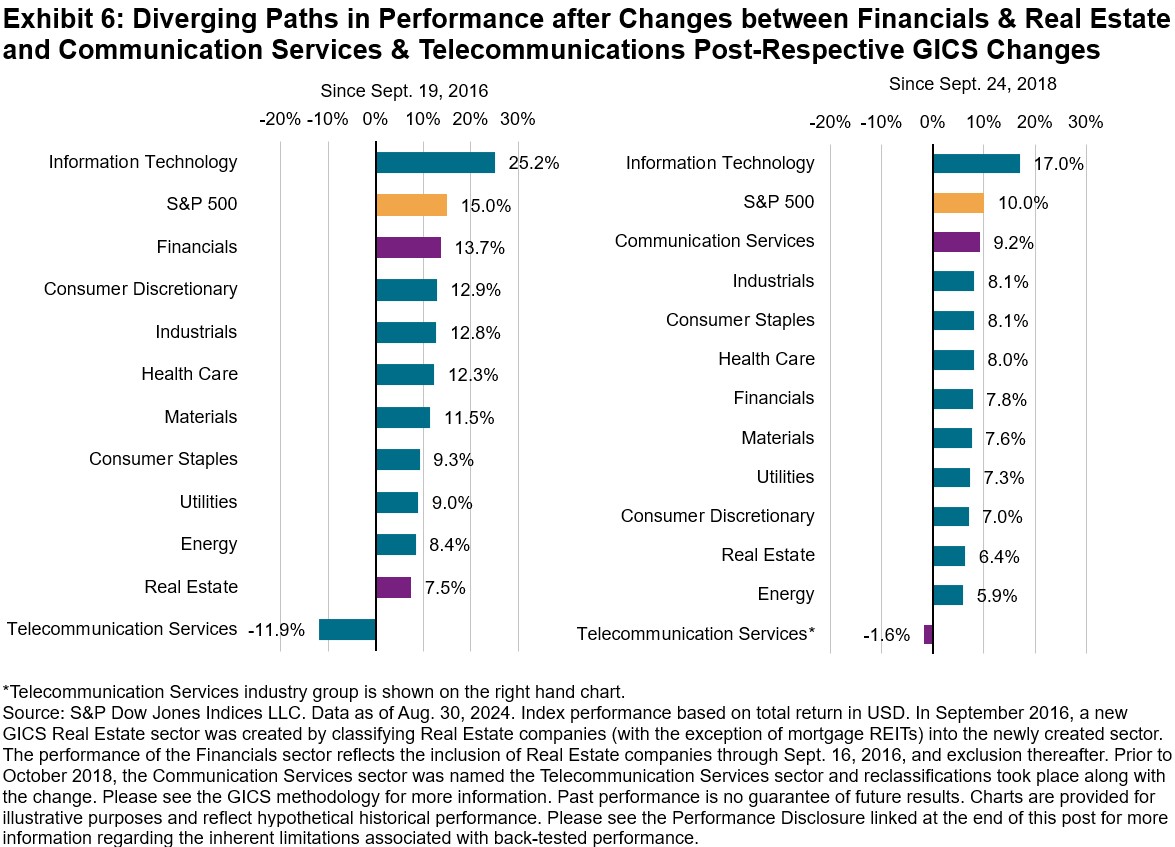
When we look at the performance of these new and old sector segments, we can see clear distinctions in performance, between Financials and Real Estate as well as Communication Services and Telecommunications, as shown in Exhibit 6.

While we looked at the S&P 500 in this blog, the power of GICS is that similar analysis can be performed on any broad-based index across different markets. Looking at several emerging and frontier markets, we can see that “old economy” sectors such as Financials and Real Estate still dominate local indices, exhibiting potential opportunities for diversification with U.S. equity sectors.

GICS remains an effervescent tool for a range of market practitioners and reflects today’s trends. GICS also has the flexibility to adapt and change over time, as seen with the 2016 Real Estate and 2018 Communication Services transformations. Here’s to the next 25 years and beyond!

The posts on this blog are opinions, not advice. Please read our Disclaimers.

Back to Basics: Remembering the "Income" in Fixed Income

Contributor Image
Jennifer Schnabl

Former Head of Global Fixed Income Indices

S&P Dow Jones Indices

As we approach Q4, the fixed income markets are taking stock of where they’ve been and what is to come. Markets are expecting a highly anticipated shift in monetary policy to take place before the end of the year, which would mark a turning point in one of the most aggressive interest rate hiking cycles the U.S. has seen. Until now, most fixed income segments have weathered the volatility in the rate market, turning in varied performance on a YTD basis. Although “higher for longer” currently feels more like “higher for not much longer,” historically high yields across fixed income assets remain for the time being.

Finance textbooks remind us of the traditional role that fixed income plays in a typical portfolio. First, fixed income provides diversification from other asset classes, like equities. Second, fixed income provides a source of capital preservation, in that the principal amount is expected to be returned at a scheduled maturity date. And third, as implied in the name “fixed income,” there is an expectation of predictable income associated with bonds via a fixed coupon. This predictability or “fixed” nature can play an important role for investors as they plan their future income needs. As fixed income yields are forward-looking, it is important to highlight the historically high levels of yields across most areas of fixed income, particularly as we approach a potential pivot in rate policy.

A snapshot of the environment prior to the Fed’s rate hiking cycle, which commenced in 2022, shows that yields—as measured by our broad range of fixed income indices—were at some of their lowest levels in decades, a reminder of the potential income associated with a low-rate regime. Today’s picture not only offers some of the highest yields in decades, but a more convergent picture across fixed income, in which the differences between asset classes are smaller than those of the past.

While fixed income yields are heavily intertwined with the level of overnight rates, as determined by the U.S. Federal Reserve, it is notable to observe the timing and nature of this relationship over time. The broad-based U.S. Treasury yield, as measured by the iBoxx USD Treasuries Index, has historically moved closely in line with the daily Fed funds rate. It has also reacted along with, and often times prior to, an announcement of a change in the Fed funds rate. U.S. investment grade yields, as measured by the iBoxx USD Investment Grade Index, have behaved in a similar fashion; however given the credit component, there are additional factors that drive their movements.

Another aspect at play in the current environment is the shape of the interest rate curve, and how that has affected investor positioning. An inverted yield curve environment in U.S. rates emerged in 2022 and has persisted since, although there have been moments of flattening in 2024. As such, yields at the shorter end of the curve have been higher than the longer end of the curve. This, coupled with the interest rate volatility the market has weathered since Fed policy was put on hold in 2023, has made the front end a common place for portfolio allocation. However, this positioning may change as the yield profiles along the curve change, extending duration to track today’s yields. Based on historical occurrences, if the anticipated lowering of policy rates takes shape, and the curve normalizes, some positions may move from the front end to further out the curve.

The posts on this blog are opinions, not advice. Please read our Disclaimers.

Beyond Diversification: U.S. Equity and Sector Relevance in Mexico

Contributor Image
Cristopher Anguiano

Associate Director, U.S. Equity Indices

S&P Dow Jones Indices

Many investors tend to overweight domestic equities, a phenomenon known as home bias. Mexican investors may be inadvertently neglecting the breadth of global equity markets by focusing primarily on local options. The significant representation of the U.S. equity market means that some investors risk overlooking a significant portion of the global equity market and the potential diversification benefits from incorporating U.S. equity exposures.

The global relevance of the U.S. equity market can be illustrated by its size: U.S.-domiciled companies represent around 60% of the global equity market capitalization, as represented by the S&P Global BMI. This representation is far higher than the weight of Latin America (0.9%) and Mexico (0.3%). As a result, the consideration of U.S. equities can help investors gain a clearer understanding of global equity performance and support the expression of strategic and tactical views. This is also relevant at a sector level: U.S. companies account for most of the global equity opportunity set in 10 out of 11 global GICS® sectors.

To further illustrate the relevance of U.S. equity exposure, we compare the distinct sectoral compositions of the S&P/BMV IPC and the S&P 500®. The S&P/BMV IPC tracks the performance of the largest and most liquid Mexican stocks. Exhibit 2 shows that, as of May 2024, the index had significant weightings in Consumer Staples, Financials and Materials. Conversely, the S&P 500 had higher exposure to Information Technology, Health Care, Consumer Discretionary, Energy and Utilities. Incorporating U.S. equities could therefore help Mexican investors to diversify domestic sector biases.

The performance of U.S. equities has historically presented potential diversification benefits to Mexican investors. We demonstrate this by building hypothetical portfolios that blend the S&P 500 and its GICS sector indices with the S&P/BMV IRT, allocating 25% to U.S. equities and 75% to local equities, rebalanced annually. Exhibit 3 indicates that this hypothetical approach yielded higher performance and lower volatility, historically, thereby improving the hypothetical portfolios’ long-term risk-adjusted returns.

Beyond the strategic relevance of U.S. equities, the historical performance of U.S. sectors around U.S. Presidential elections has presented the idea of U.S. sectors having tactical relevance. Historically in election years, sector performance spreads have widened in November, as Exhibit 4 illustrates. While the S&P 500’s overall performance remained relatively stable in recent elections, sectoral fluctuations contributed to nearly half of the index’s monthly dispersion—a measure to determine the spread of stock returns within the index, highlighting the importance of sectors to express views.

The U.S. equity market represents a sizable portion of the global equity opportunity set. Incorporating U.S. equities not only potentially offers Mexican investors a way to alleviate domestic sectors biases, it has historically enhanced risk-adjusted returns. Additionally, U.S. sectors serve as the basis for market strategies and positioning, and our sector indices offer a measure for investors seeking to express both tactical and core portfolio views.

The posts on this blog are opinions, not advice. Please read our Disclaimers.

Indexing Covered Calls for Insurance

How can an emphasis on rules-based predictability provide greater clarity in risk and return assessment? In an interview with Insurance Asia News, S&P DJI’s Priscilla Luk explores how an index-based approach to covered calls may help insurance companies to mitigate the impact of market volatility. 

The posts on this blog are opinions, not advice. Please read our Disclaimers.

Equal Weight Indexing in Canadian Equities

Contributor Image
Anna Mittra

Associate Director, Global Exchanges

S&P Dow Jones Indices

The S&P 500 Equal Weight Index has exhibited notable long-term outperformance compared to the market-cap-weighted S&P 500—a phenomenon that has been researched over the years. Unlike the headline S&P 500, where larger companies exert a greater influence, the S&P 500 Equal Weight Index assigns the same weight to each of its constituents, regardless of their market cap. This approach increases the weight in smaller companies, allowing them to have a more significant impact on the index’s overall performance.

We find a similar pattern in the Canadian market, where the S&P/TSX 60 Equal Weight Index has outperformed the S&P/TSX 60 over the long term (see Exhibit 1). Despite periods where the S&P TSX 60 outperformed due to the dominance of its largest constituents, the S&P/TSX 60 Equal Weight Index has historically provided a more balanced view of the Canadian equities market and less concentration risk, leading to enhanced long-term returns.

Performance Summary

As shown in Exhibit 1, the S&P/TSX 60 Equal Weight Index has outperformed the S&P TSX 60 over the long term by a cumulative 24%, approximately, with a notable degree of outperformance occurring during market recoveries, particularly following the Global Financial Crisis and COVID-19 pandemic.

The S&P/TSX 60 Equal Weight Index consistently outperformed the S&P/TSX 60 across various time frames at a roughly similar level of volatility, leading to enhanced risk-adjusted returns (see Exhibit 2).

A quarterly performance analysis (see Exhibit 3) shows that the S&P/TSX 60 Equal Weight Index has outperformed the cap-weighted index at a rate of 52% with an average margin of outperformance (1.69%) exceeding that in underperforming quarters (-1.35%), underscoring the index’s effectiveness in outperforming across different market cycles.

 Reduced Sector and Single Stock Concentration

 In terms of sector weights, the S&P/TSX 60 Equal Weight Index offers a more diversified representation of the Canadian market. This contrasts with the S&P/TSX 60, which reflects the Canadian equity market’s heavy weighting toward the Financials sector, with substantial weight distributed to the big five banks. This sector concentration can lead to performance that is highly driven by the financial market conditions and regulatory changes affecting this industry. In contrast, the S&P/TSX 60 Equal Weight Index provides more balanced sector profile, giving larger representation to other sectors such as Consumer Discretionary, Utilities, and Real Estate (see Exhibit 4). This broader sector profile has historically enhanced performance during periods when sectors other than Financials have outperformed, provide market participants with a more comprehensive view of the market.

Additionally, Exhibit 5 highlights key differences in constituent level weight distribution. The S&P/TSX 60 is heavily tilted toward its largest companies, with the top five making up 25.8% of the index weight. Meanwhile, the S&P/TSX 60 Equal Weight Index distributes weight more evenly, resulting in only 9.3% for the same group. This structure leads to different performance dynamics, with the equal weight index’s performance being more influenced by smaller size constituents, rather than being driven by larger names.

Conclusion

Despite the limited use of equal weight strategies in Canadian equities at present, the high level of stock and sector concentration in the market suggests there are potential merits of considering an equal weight approach to indexing. This hypothesis is further supported by the historical outperformance of the S&P/TSX 60 Equal Weight Index compared to its market-cap-weighted counterpart over both short- and long-term periods.

The posts on this blog are opinions, not advice. Please read our Disclaimers.