Get Indexology® Blog updates via email.

In This List

2023 SPIVA Institutional Scorecard: SMAs/Wrap Accounts Are Here!

Fees and Fortunes

The Sector Effect during U.S. Presidential Election Years

An Adaptive Approach to Multi-Asset Diversification

Size, Momentum and Value

2023 SPIVA Institutional Scorecard: SMAs/Wrap Accounts Are Here!

Contributor Image
Michael Brower

Former Associate Director, Index Investment Strategy

S&P Dow Jones Indices

First published in 2002, the S&P Indices versus Active (SPIVA®) U.S. Scorecard measures the performance of active mutual fund managers against their respective S&P DJI benchmarks over various time horizons and across asset classes. In 2015, we extended the analysis to include institutional accounts to understand how institutional asset owners fared versus mutual funds against their respective benchmarks and the impact of fees on performance.

In our 2023 edition, we have further expanded our purview of assessing active manager performance to now include separately managed accounts (SMAs)/wrap accounts. SMAs may offer potential benefits such as increased customization, greater transparency and direct ownership of securities in a portfolio. With the addition of these accounts, we can examine the performance of professionally managed portfolios held by retail investors against their respective benchmarks.

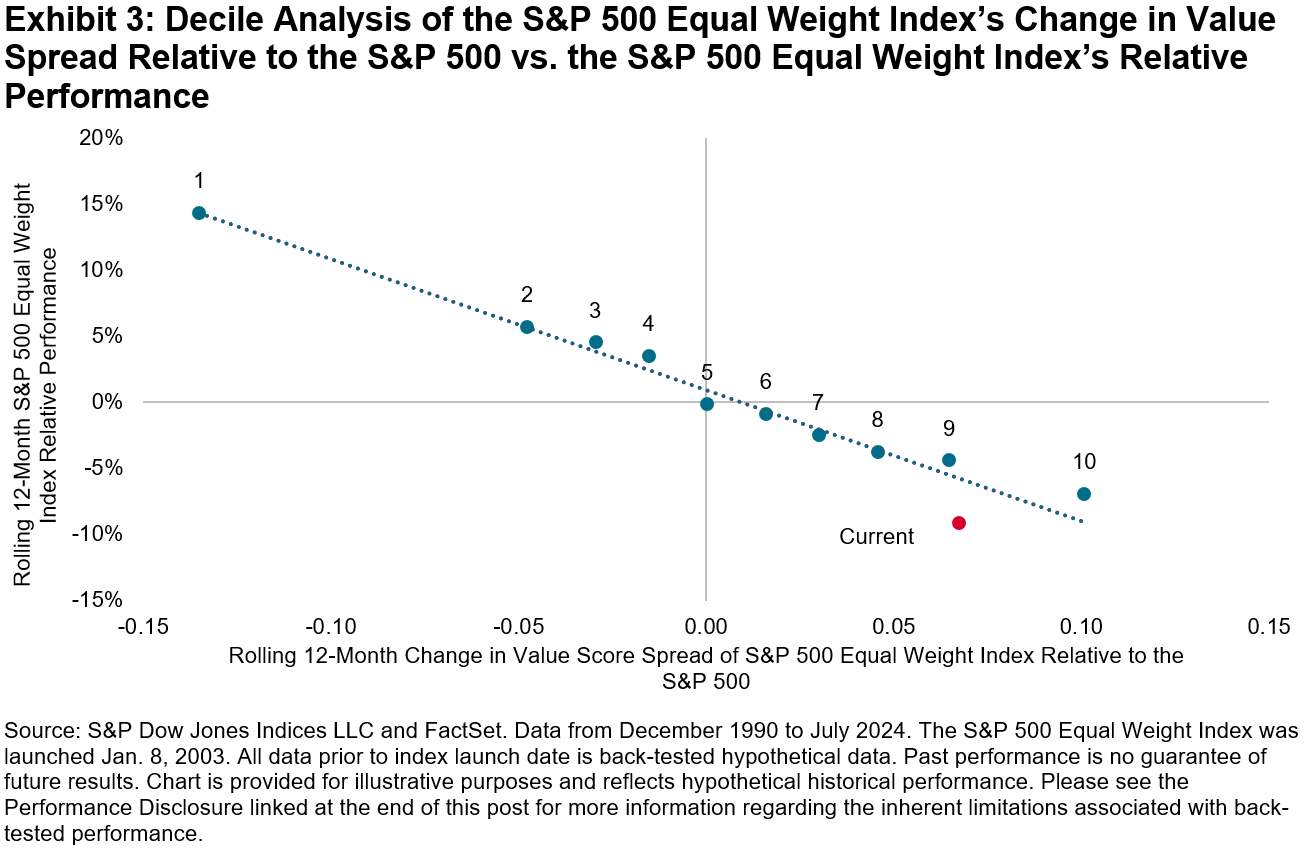
Our reported SMA/wrap categories span across equities and fixed income. In 2023, in our most closely watched category of All Large-Cap Funds, 72% of SMA/wrap managers underperformed the S&P 500® on a gross-of-fees basis, lagging their institutional account and mutual fund peers (see Exhibit 1).  Large-cap managers may have been hampered by the dominance of mega-cap stocks, especially if they were underweighted in comparison to their benchmark weights.

In contrast, mid- and small-cap managers fared much better. Only 42% of mid-cap and 30% of small-cap managers underperformed their respective benchmarks. One potential explanation for these results may be style bias opportunities among smaller-cap managers, who may have benefited by taking strategic tilts toward outperforming larger-cap stocks, with the S&P 500 outperforming the S&P MidCap 400® and the S&P SmallCap 600® by 9.9% and 10.2%, respectively.

Style bias often explains performance across the capitalization spectrum; it may be easier for small- and mid-cap managers to tilt their portfolios toward larger companies with greater liquidity or to let their winners run. Historically, the odds of success for mid- and small-cap managers have improved when larger stocks have outperformed, with majority outperformance for small-cap mutual funds in 7 out of the past 22 years, of which 6 years coincided with large-cap outperformance.

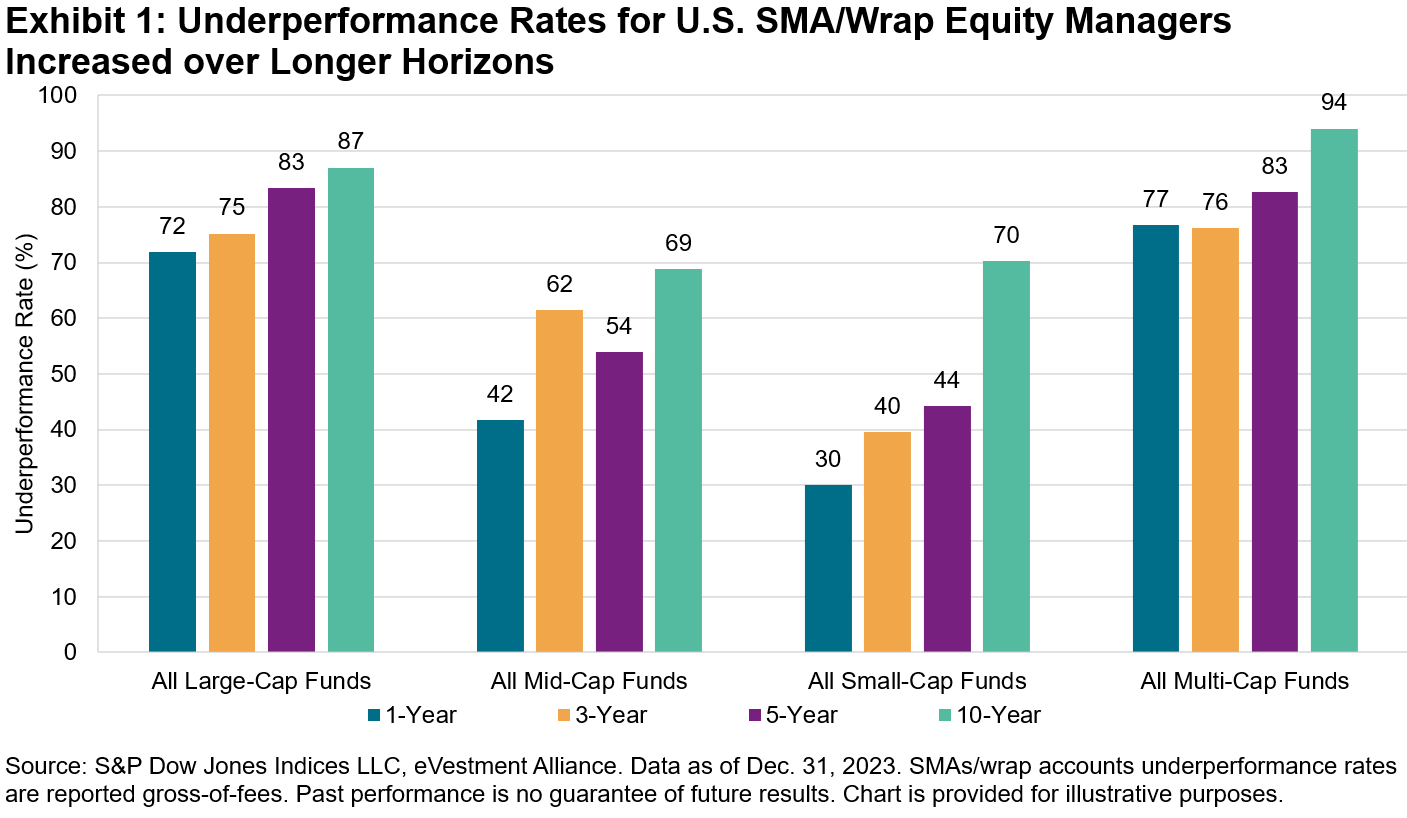
SMA/wrap results within fixed income were mixed in 2023 across our three reported categories (see Exhibit 2). U.S. Aggregate accounts posted majority outperformance, followed by a moderate showing for Core, with 51% of accounts underperforming, and bleaker results within the muni space, with 86% of Municipal accounts underperforming the S&P National AMT-Free Municipal Bond Index.

While there were a few categories with majority outperformance in 2023, our SPIVA scorecards have consistently shown that outperforming a benchmark over time is challenging, and this continues to ring true for SMAs/wrap accounts. Exhibits 1 and 2 show that more than 70% of accounts across equity SMA/wrap categories and more than 50% across fixed income categories underperformed their respective benchmarks over the 10-year period ending Dec. 31, 2023. For more detailed information on how SMAs/wrap accounts fared last year, please see our 2023 SPIVA Institutional Scorecard.

The author would like to thank Anu Ganti and Davide Di Gioia for their contributions to this post.

The posts on this blog are opinions, not advice. Please read our Disclaimers.

Fees and Fortunes

Contributor Image
Anu Ganti

Head of U.S. Index Investment Strategy

S&P Dow Jones Indices

One of the potential advantages of indexing is its typically lower cost relative to active management. Investors have benefited substantially by saving on fees. And as indexing has expanded across asset classes, these rewards have compounded, especially in fixed income, where fees can prove more influential.

In Exhibit 1, we see that index mutual fund expense ratios in the U.S. have been consistently lower than their active counterparts for the past couple of decades. Although that spread has narrowed in recent years, we still observe a fee differential of 60 bps across equities and 41 bps across bonds as of 2023.

Exhibit 1- Passive Equity and Bond Mutual Fund Expense Ratios Are Significantly Lower than Active

In addition to fee savings, index-tracking investors may have also benefited by avoiding active underperformance. Particularly germane to the equity markets, our SPIVA® Scorecards show that only a handful of actively managed mutual funds have outperformed the benchmark. But how do we account for institutional investors who, unlike retail investors, claim an advantage in selecting skillful asset managers coupled with a better vantage point to negotiate fees?

Our SPIVA Institutional Scorecard seeks to shed light on these questions, providing coverage of the performance of institutional accounts along with mutual fund data from the flagship SPIVA U.S. Scorecard. Exhibit 2 plots the differential in 10-year underperformance rates between institutional accounts versus mutual funds on both a net and gross-of-fees basis.

The chart illustrates several notable observations. First, long-term net-of-fees performance for institutional accounts was better compared to mutual funds in 20 out of 21 reported equity segments, with International Small-Cap Funds a noticeable outlier. Second, gross-of-fees relative performance for institutional accounts was better for 17 out of 21 equity categories. Third, except for a few categories, differences between mutual fund and institutional account underperformance rates were generally negligible, with majority underperformance for institutional accounts across all categories, on both a gross and net-of-fees basis.

Exhibit 2- Differences between Institutional Account and Mutual Fund 10-Year Underperformance Rates Were Generally Negligible across Most Equity Categories

While long-term results may slightly favor institutional accounts versus mutual funds, results can vary over the short term. In our most closely watched category, All Large-Cap Funds, 66% of institutional accounts underperformed the S&P 500® in 2023, worse than the 60% rate we observed for active large-cap mutual funds. Consistent 10-year majority underperformance rates across categories highlight the challenges of outperformance and show that institutional investors are no exception to the rule. Find out more about how institutional equity and fixed income managers fared last year in our SPIVA Institutional Year-End 2023 Scorecard.

The posts on this blog are opinions, not advice. Please read our Disclaimers.

The Sector Effect during U.S. Presidential Election Years

History suggests that sectors have a greater potential to over- and underperform during U.S. presidential election years. Join S&P DJI’s Ed Ware, Anu Ganti and Hamish Preston for a closer look at some of the drivers behind election years’ tendency to offer greater sector outperformance opportunities than non-election years.


The posts on this blog are opinions, not advice. Please read our Disclaimers.

An Adaptive Approach to Multi-Asset Diversification

A static approach to multi-asset index construction may be slow to react to changing markets. Discover how the S&P 500 Market Agility 10 TCA Index dynamically manages its allocations to stocks and bonds to respond rapidly to market movements and yield curve trends.

The posts on this blog are opinions, not advice. Please read our Disclaimers.

Size, Momentum and Value

Contributor Image
Anu Ganti

Head of U.S. Index Investment Strategy

S&P Dow Jones Indices

Burgeoning optimism surrounding impending potential Fed rate cuts and a rotation toward smaller-cap stocks in July may have been short-lived, as global market jitters led to the trouncing of stocks across the capitalization spectrum on Aug. 5, 2024. The S&P 500® plunged 3%, its largest daily decline in almost two years.

Despite this recent pullback, the outperformance of mega-cap stocks has been one of the most analyzed market themes of the past year, leading to severe underperformance of the small size factor. In parallel, the continuous outperformance of winning stocks across the cap spectrum led to the dramatic outperformance of the momentum factor. The S&P 500 Momentum Index outperformed the S&P 500 by more than 30% through the 12 months ending in July 2024, while the S&P 500 Equal Weight Index, which has a smaller-cap bias by design, underperformed the S&P 500 by 9% over the same period.

Exhibit 1 plots the historical 12-month relative performance for both indices, from which we can glean two observations: the S&P 500 Momentum Index and S&P 500 Equal Weight Index have an inverse relationship, not surprising given the latter’s innate rebalancing mechanism of selling relative winners and buying relative losers, which is the opposite of momentum-based strategies. Secondly, the S&P 500 Equal Weight Index’s outperformance tended to follow after peaks in the S&P 500 Momentum Index outperformance, most prominently after the burst of the tech bubble in the late 1990s, which makes the current environment an interesting one to examine the S&P 500 Equal Weight Index.

Larger stocks often carry heftier valuations than smaller stocks, and stocks that have fallen in price more than their peers are often more favorably valued as their prices continue to decline. As a result, we can expect the S&P 500 Equal Weight Index, which has a small size and anti-momentum bias, to also have a value bias.

The S&P 500 Equal Weight Index’s positive value tilt is evident from Exhibit 2, which calculates the spread of the index-weighted value score for the S&P 500 Equal Weight Index versus the S&P 500. The spread is generally positive, and we see that the index’s value tilt has increased over the past year, as performance has suffered.

To provide further historical context, we group our database into deciles by their rolling 12-month change in value spread, and in Exhibit 3, we plot the average change in value spread on the x-axis, and the average relative performance of the S&P 500 Equal Weight Index on the y-axis. We again see an inverse relationship between changes in the index’s value spread and its relative performance compared to its cap-weighted counterpart.

The current environment is situated just past decile 9, indicating that the S&P 500 Equal Weight Index has become relatively more undervalued compared to the S&P 500.

Whether we will experience a sustained pullback in mega-cap strength or a reversal in momentum remains to be seen. But if history is any guide, a potential decrease in the S&P 500 Equal Weight Index’s value exposure corresponding with relative outperformance would not be surprising.

The posts on this blog are opinions, not advice. Please read our Disclaimers.